 عربي
عربي
Palestinian Central Bureau of Statistics (PCBS)
· Around 113,000 of Individuals in Palestine Suffered from at Least One Disability in 2011
· More than one third of disabled individuals have never been to school and Majority of disabled do not work
Prevalence of disability in Palestine
Prevalence among males is higher than females,
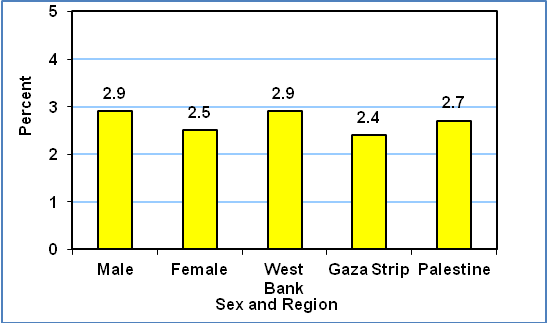
Around 113,000 of individuals suffered from at least one disability, formed 2.7% of population in Palestine, 75,000 in the West Bank; 2.9%, and around 38,000 in Gaza Strip; 2.4%. while it was 2.9% for males and 2.5% for females.
Percentage of Disabled Individuals, 2011
More than one third of disabled individuals have never been to school and Majority of disabled do not work
Around 37.6% of all disabled individuals aged 15 years and above in Palestine had never been enrolled at school; 35.5% in the West Bank and 42.2% in Gaza Strip. In addition, 33.8% of all disabled individuals had dropped out of school; 37.0% in the West Bank and 27.1% in Gaza Strip. Illiteracy rates were 53.1% of all disabled individuals; 51.5% in the West Bank and 56.3% in Gaza Strip.
87.3% of all disabled individuals in Palestine were not in employment; 85.6% in the West Bank and 90.9% in Gaza Strip.
Adaptations Needed in Schools by Disabled 10-17 Years Currently Enrolled in Education
Seeing disabilities:
24.5% of individuals with Seeing disabilities require adaptations to transportation in their schools in order to continue their education: also, one-quarter require adaptations to school buildings, 38.5% require adaptations in classrooms, while 11.5% require adaptations to toilet facilities.
Hearing disabilities:
15.2% of individuals with hearing disability require adaptations to transportation to continue their education; 12.5% require adaptations to school buildings, 24.2% require adaptations in classrooms, while 3.1% require adaptations to toilet facilities.
Communication disabilities:
12.5% of individuals with communication disabilities require adaptations to transportation in their schools to continue their education; 6.3% require adaptations to school buildings, 12.5% require adaptations in classrooms, while 12.5% require adaptations to toilet facilities.
Mobility disabilities:
50.0% of individuals with mobility disabilities require adaptations to transportation in their schools to continue their education; 46.3% require adaptations to school buildings, half of individuals require adaptations in classrooms, while 52.8% of individuals require adaptations to toilet facilities.
Remembering and Concentrating disabilities:
25.0% of individuals with Remembering and Concentrating disabilities require adaptations to transportation in their schools to continue their education; 20.0% require adaptations to school buildings, 21.1% require adaptations in classrooms, and 10.5% of require adaptations to toilet facilities.
Learning disabilities:
3.8% of individuals with learning disabilities require adaptations to transportation in their schools to continue their education; 1.9% require adaptations to school buildings, 5.8% of individuals require adaptations in classrooms, and 1.9% require adaptations to toilet facilities.
Adaptations Needed by Disabled 18 Years and Above Currently Without Work in Order to Find Jobs
Transportation:
34.7% of individuals with mobility disabilities stated that they need adaptations to transportation to reach work, compared to 31.7% of individuals with Seeing disabilities, 20.0% with mental health disabilities, 17.6% with hearing disabilities, and 12.5% for individuals with communication disabilities.
Disabled toilets:
26.4% of individuals with mobility disabilities stated that they need disabled toilet facilities in work compared to 16.1% for individuals with visual disabilities, 9.1% with Remembering and Concentrating disabilities, and 5.9% with hearing disabilities, and 6.7% for individuals with mental disability.
Technological equipment and laptops to take notes:
44.4% of individuals with communication disabilities stated that they need technological aids for work compared to 26.5% for individuals with Seeing disabilities, 22.6% with hearing disabilities, and 1.4% with mobility disabilities.
Adaptations in the workplace:
36.4% of individuals with learning disabilities stated that they need adaptations to be made in the workplace compared to 28.8% of individuals with mobility disabilities, 25.8% with Seeing disabilities, 20.6% with hearing disabilities, and 16.7% for individuals with mental health disabilities.