 عربي
عربي
Palestinian Central Bureau of Statistics (PCBS)
Reality of the Private and Non-Government Enterprises in Palestine*2022
62% Of the Total Number of Employees in Private and Non-Government Enterprises are Waged Employees.
522,360 employed persons in an economic enterprises operating in Palestine (348,793 employed persons in the West Bank and 173,567 employed persons in Gaza Strip), with a decrease by 0.4% compared with 2021.
Among the percentage distribution in 2022, internal trade activity contributed to the highest percentage of operating among employees with 40.9% of the total number of employees, followed by services that constituted 32.8%, industry 18.4%, finance and insurance activities 3.1%, information and communications activities 1.8%, and the percentages of the construction, and transportation and storage activities reached 1.5% for everyone.
The number of employees ranged between unpaid employees (owners of the enterprises and their households members) which constituted 38.0% of the total number of employees, and wage employees that constituted 62.0% of the total number of employees. The total value of compensation for wage employees reached USD 2,647.1 million.
Number of Employees in Private and Non-Government Sectors by
Economic Activity and Region in 2022
|
Economic Activity |
Region |
||
|
West Bank* |
Gaza Strip |
Palestine* |
|
|
Industry |
76,850 |
19,259 |
96,109 |
|
Construction |
4,845 |
2,921 |
7,766 |
|
Internal Trade |
134,842 |
78,911 |
213,753 |
|
Transportation and Storage |
5,621 |
2,137 |
7,758 |
|
Information and Communications |
7,035 |
2,523 |
9,558 |
|
Finance and Insurance |
14,449 |
1,648 |
16,097 |
|
Services |
105,151 |
66,168 |
171,319 |
|
Total |
348,793 |
173,567 |
522,360 |
Industry Activities Constituted the Highest Value of Output of the Economic Activities in Palestine*
The total value of output by economic enterprises was USD 15,405.8 million in Palestine (USD 13,053.6 million in the West Bank and USD 2,352.2 million in Gaza Strip).
Among the percentage distribution 2022, industrial activities contributed with 33.1% of the total output followed by internal trade activities that constituted 32.9%, services activities reached 20.5%, finance and insurance activities reached 7.4%, information and communications reached 3.9%, while percentages of construction activities and transportation and storage activities reached 1.3% and 0.9%, respectively.
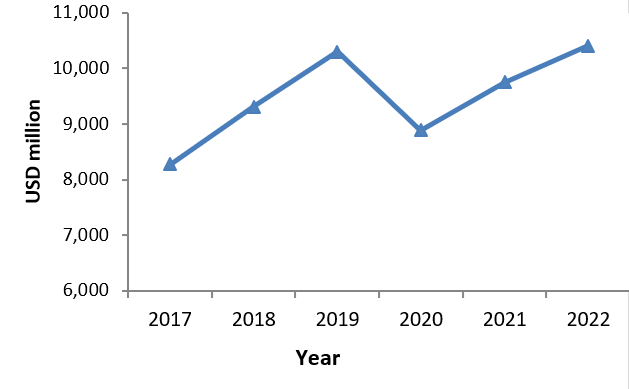
An Increase of 6.7% in the Value Added of the Economic Activities in Palestine* in 2022 Compared with 2021.
Results showed that the total value added of economic activities in 2022 was USD 10,410.5 million with an increase of 6.7% compared with 2021.
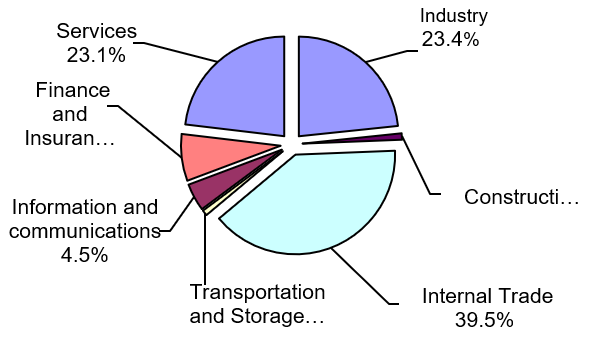
In 2022, the highest value added was from the internal trade activities with a percentage of 39.5%, followed by industry activities with a percentage of 23.4%, services activities with a percentage of 23.1%, finance and insurance activities with a percentage of 7.6%, information and communications activities with a percentage of 4.5%, construction 1.0%, and transportation and storage with a percentage of 0.9%.
Value Added of Economic Activities in Palestine* for the years 2017-2022
Percentage Distribution of Value Added from Economic Enterprises Operating in the Private and Non-Government Sectors in Palestine* by Economic Activity, 2022
Note:
*Data exclude those parts of Jerusalem, which were annexed by Israeli occupation in 1967.