 عربي
عربي
Palestinian Central Bureau of Statistics (PCBS)
The Industrial Production Index (IPI) in Palestine during 2025 & December, 12/2025
Increase in the Industrial Production Index (IPI) in Palestine during 2025
The overall IPI in Palestine with its Base Year (2019 = 100) reached 82.72 in 2025, which indicates an increase by 3.39% compared to 2024.
IPI for 2025 increased due to the increase in the activities of Manufacturing Industry by 4.48%, and the activities of Electricity, Gas, Steam and Air Conditioning Supply by 3.22%. While, the activities of Water Supply, Sewerage, Waste Management and Remediation sharply decreased by 22.67%, and the activities of Mining and Quarrying by 2.60%.
The table below shows yearly percent changes in IPI in Palestine for the period
2013 – 2025:
|
Year |
Percent Changes % |
|
2013 |
+ 7.82 |
|
2014 |
- 3.92 |
|
2015 |
- 3.80 |
|
2016 |
+ 0.96 |
|
2017 |
+ 4.11 |
|
2018 |
- 3.94 |
|
2019 |
+ 3.86 |
|
2020 |
- 7.95 |
|
2021 |
+ 14.13 |
|
2022 |
+ 3.27 |
|
2023 |
- 8.01 |
|
2024 |
- 19.84 |
|
2025 |
+ 3.39 |
Decrease in the Industrial Production Index (IPI) in Palestine during December 2025
The overall IPI in Palestine reached 83.50 during December 2025 with a decrease of 1.03% compared to November 2025 (Base Year 2019 = 100).
IPI for December 2025 decreased due to the decrease in the activities of Mining and Quarrying by 3.28%, which had a share of 2.89% of the total industry, and the activities of Manufacturing Industry by 2.82%, which had a share of 87.89% of the total industry, While, the activities of Electricity, Gas, Steam and Air Conditioning Supply sharply increased by 14.87%, which had a share of 2.82% of the total industry, and the activities of Water Supply, Sewerage, Waste Management and Remediation by 4.68%, which had a share of 1.84% of the total industry.
The table below shows monthly percent changes in IPI for the period:
January – December 2025:
|
Month |
Percent Changes (%) |
|
January |
- 1.26 |
|
February |
+ 1.86 |
|
March |
- 2.83 |
|
April |
+ 0.94 |
|
May |
+ 3.57 |
|
June |
- 9.41 |
|
July |
+ 14.34 |
|
August |
+ 3.11 |
|
September |
+ 5.78 |
|
October |
- 7.48 |
|
November |
- 1.57 |
|
December |
- 1.03 |
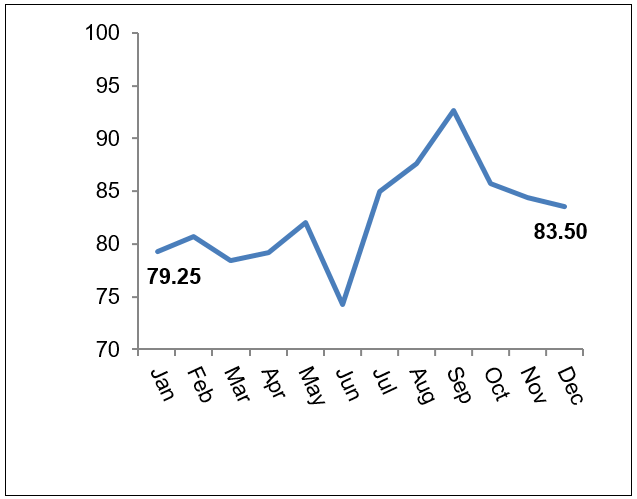
The trend line of the Industrial Production Index in Palestine, for the period: January - December 2025 (Base Year 2019 = 100)
Notice for Users:
Due to the Israeli aggression on Gaza strip in October 2023, all working institution in the industrial production wasn’t engaged in any production activity in Gaza strip for December 2025.
Please note that the press release in English is brief compared to the Arabic version.